How To Use Icinga To Monitor Your Servers and Services On Ubuntu 14.04
Introduction
In this tutorial, we will go over the installation of Icinga, an open source monitoring system, on Ubuntu 14.04. We will cover some basic configuration, so you will be able to monitor network services and host resources via the web interface. We will also utilize the Nagios Remote Plugin Executor (NRPE), that will be installed as an agent on remote systems to monitor their local resources (disk usage, number of logged in users, etc.).
Icinga is a popular open source monitoring system that checks hosts and services, and notifies you of their statuses. Icinga is a fork of Nagios, so they are compatible and share many similarities, and it has been gaining popularity due to a more agile development cycle when compared to Nagios.
Prerequisites
To complete this tutorial, you will require root access to an Ubuntu 14.04 VPS. Instructions to set that up can be found here (steps 3 and 4): Initial Server Setup with Ubuntu 14.04.
Also, if you want to set up the mail notification feature, you will need to properly configure Postfix. Instructions to do that can be found here: How To Install and Setup Postfix on Ubuntu 14.04. Postfix is installed along with the Icinga packages, but it can be configured after Icinga is set up.
Install Icinga
We will install Icinga using packages. Also, we will use MySQL as our DBMS--PostgreSQL, SQLite, and Oracle are the other supported options.
Run the following command to add the Icinga PPA to your package manager:
sudo add-apt-repository ppa:formorer/icinga
Then update your apt package database:
sudo apt update
Now install Icinga and MySQL with apt:
sudo apt install icinga icinga-doc icinga-idoutils mysql-server libdbd-mysql mysql-client
Now you will be presented with a series of prompts regarding your Icinga installation. Here is a list of the prompts, and how you should answer them:
- MySQL Configuration: Enter a new MySQL root user password
- PostFix Configuration: Select "Internet Site"
- PostFix Configuration: Enter your Fully Qualified Domain Name (example.com, for example)
- Configuring icinga-cgi: Enter "icingaadmin" user's password (login to access Icinga).
- Configuring icinga-common: Enter "No" to enabling external commands
- Configuring icinga-idoutils: Enter "Yes" to configuring database for icinga-idoutils with dbconfig-common
- Configuring icinga-idoutils: Select "mysql" as the database type
- Configuring icinga-idoutils: Enter MySQL root password (that you just assigned above)
- Configuring icinga-idoutils: Enter a new icinga-idoutils database user password
Icinga is now installed, but we still need to configure a few things before we can start it. Note that Apache HTTP server and Postfix were installed as part of that process.
Add Apache user (www-data) to nagios group:
sudo usermod -a -G nagios www-data
Enable the ido2db daemon to start on boot up, which stores Icinga events and configurations in the database. Edit Icinga default configuration:
sudo vi /etc/default/icinga
Change the value of
IDO2DB to yes, so it looks like the following:IDO2DB=yes
Save and quit. Now start the
ido2db service:sudo service ido2db start
Enable idomod module by copying the sample idoutils.cfg file to Icinga's active configuration:
sudo cp /usr/share/doc/icinga-idoutils/examples/idoutils.cfg-sample /etc/icinga/modules/idoutils.cfg
Now Icinga is configured and ready to be started:
sudo service icinga restart
Let's try out the Icinga user interface.
Accessing the Icinga User Interface
Go to http://yourhost/icinga, and log in using the icingaadmin login that you set up during the Icinga installation.
You should see that Icinga is monitoring one host, localhost (your Icinga server), and seven services, like this:
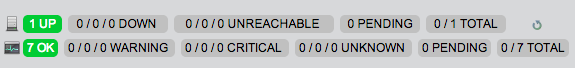
The top row shows that the single monitored host is "Up", and the bottom row shows that there are seven "OK" monitored services.
If the status of localhost is "Down", you might need to change the permissions of your ping command. Run the following command to allow the nagios user to use the ping command:
sudo chmod u+s `which ping`
Let's add more hosts and services to be monitored!
Ways To Monitor With Icinga
There are two main ways to monitor hosts and services with Icinga:
- Monitoring "publicly available services"
- Monitoring via an agent that is installed on a remote host to gather and send data to Icinga
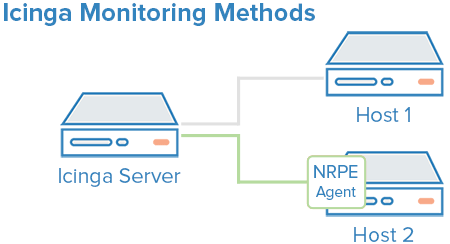
With the first method, publicly available services refers to services that are accessible across the local network or the Internet. Common examples include HTTP, mail, SSH, and ICMP ping. This method is useful for monitoring systems that you can't (or don't want to) install an agent on, and also for monitoring user facing network interfaces.
To implement the second method, we will install NRPE as an agent on remote hosts to monitor their local resources. This will allow Icinga to monitor things like disk usage, running processes, and other system stats that the first method can't achieve.
Method 1: Monitoring Publicly Available Services
Because the first method simply monitors listening services, the configuration for this method is done all on the Icinga server. Several things can be monitored with this method, so we will demonstrate how to monitor a public interface of a web server.
Create a file with the name of your host, with this command (substitute
yourhost with your own hostname):sudo vi /etc/icinga/objects/yourhost.cfg
Now add the following, replacing the values of
host_name with your own hostname (in both places),alias with a description of the host, and address with the value of your host's public IP address:define host {
use generic-host
host_name web-1
alias A Web Server
address 107.170.xxx.xxx
}
define service {
use generic-service
host_name web-1
service_description HTTP
check_command check_http
}
Now save and quit. Reload your Icinga configuration to put any changes into effect:
sudo service icinga reload
Method 2: Monitoring Via an Agent
As mentioned earlier, we will be using NRPE as our agent to gather remote host data for Icinga. This means that NRPE must be installed on all hosts that will be monitored with this method, and the Icinga server also needs to be configured to receive data for each host.
Let's go over installing NRPE.
Installing NRPE On a Remote Host
On a host that you want to monitor, update apt:
sudo apt update
Now install NRPE and Nagios Plugins:
sudo apt install nagios-plugins nagios-nrpe-server
Look up the name of your root filesystem (because it is one of the items we want to monitor):
df -h /
We will be using the filesystem name in the NRPE configuration to monitor your disk usage (it is probably
/dev/vda). Now open nrpe.cfg for editing:sudo vi /etc/nagios/nrpe.cfg
The NRPE configuration file is very long and full of comments. There are a few lines that you will need to find and modify:
- server_address: Set to the private IP address of this host
- allowed_hosts: Set to the private IP address of your Icinga server
- command[check_hda1]: Change
/dev/hda1to whatever your root filesystem is called
The three aforementioned lines should look like this (substitute the appropriate values):
server_address=client_private_IP
allowed_hosts=nagios_server_private_IP
command[check_hda1]=/usr/lib/nagios/plugins/check_disk -w 20% -c 10% -p /dev/vda
Note that there are several other "commands" defined in this file that will run if the Icinga server is configured to use them. Also note that NRPE will be listening on port 5666 because
server_port=5666is set. If you have any firewalls blocking that port, be sure to open it to your Icinga server.
Save and quit. Then restart NRPE to put the changes into effect:
sudo service nagios-nrpe-server restart
Once you are done installing and configuring NRPE on the hosts that you want to monitor, you will have to add these hosts to your Icinga server configuration before it will start monitoring them.
Add Remote Host To Icinga Server Configuration
On your Icinga server, create a new configuration file for each of the remote hosts that you want to monitor in
/etc/icinga/objects. Replace yourhost with the name of your host:sudo vi /etc/icinga/objects/yourhost.cfg
Add in the following host definition, replacing the
host_name value with your remote hostname (I used "wordpress-1" in my example), the alias value with a description of the host, and the address value with the private IP address of the remote host:define host {
use generic-host
host_name wordpress-1
alias My first wordpress server
address 10.128.xxx.xxx
}
Then add any of these service blocks for services you want to monitor. Note that the value of
check_command determines what will be monitored, including status threshold values. Here are some examples that you can add to your host's configuration file:
Ping:
define service {
        use                             generic-service
        host_name                       wordpress-1
        service_description             PING
        check_command                   check_ping!100.0,20%!500.0,60%
        }
SSH (notifications_enabled set to 0 disables notifications for a service):
define service {
        use                             generic-service
        host_name                       wordpress-1
        service_description             SSH
        check_command                   check_ssh
        notifications_enabled           0
        }
Load:
define service {
        use                             generic-service
        host_name                       wordpress-1
        service_description             Current Load
        check_command                   check_load!5.0!4.0!3.0!10.0!6.0!4.0
        }
Current Users:
define service {
        use                             generic-service
        host_name                       wordpress-1
        service_description             Current Users
        check_command                   check_users!20!50
        }
Disk Space:
define service {
        use                             generic-service
        host_name                       wordpress-1
        service_description             Disk Space
        check_command                   check_all_disks!20%!10%
        }
If you're wondering what
use generic-service means, it is simply inheriting the values of a service template called "generic-service" that is defined by default.
Now save and quit. Reload your Icinga configuration to put any changes into effect:
sudo service icinga reload
Once you are done configuring Icinga to monitor all of your remote hosts, let's check out the user interface.
User Interface Example
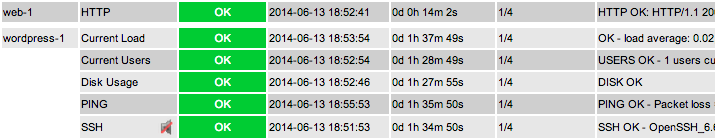
After setting up a monitoring on a few hosts with either monitoring method, go to your Icinga user interface (http://youricingaserver.com/icinga, acingaadmin login), then click on the Service Detail link. You should see a list of all of the services that you set up monitoring for.
As an example, here are two hosts that are being monitored using the configuration files that were described above. web-1 HTTP service is being monitored via its normal HTTP port, indicating that its web server is responding with an OK status, and wordpress-1 is showing that all its monitored services are OK.
Icinga has a plethora of features, so feel free to browse the interface to see what you can discover about your hosts and services.
Conclusion
Now that you monitoring your hosts and some of their services, you might want to spend some time to figure out which services are critical to you, so you can start monitoring those. You may also want to set up notifications so, for example, you receive an email when your disk utilization reaches a warning or critical threshold or your main website is down, so you can resolve the situation promptly or before a problem even occurs.
sumber/source : https://www.digitalocean.com/community/tutorials/how-to-use-icinga-to-monitor-your-servers-and-services-on-ubuntu-14-04
# apt-get install php5 php5-cli php-pear php5-xmlrpc php5-xsl php5-gd php5-ldap php5-mysql
# apt-get install php5 php5-cli php-pear php5-xmlrpc php5-xsl php5-gd php5-ldap php5-mysql
# apt-get install icinga-web

dan hasil :

*mumet
ReplyDelete